Quick Answer
Average hourly pay rose 3.09% in the year to August and prices 3.40%. After federal, FICA and state tax at each state's median wage, a worker keeps between 62% and 80% of the raise, and take-home fell behind prices in 51 of 51 jurisdictions.
In the twelve months to August, average hourly pay for private-sector workers rose 3.09%, from $36.62 to $37.75. Prices rose 3.40%. Before tax, that is a gap of 0.31 percentage points — close enough to call it keeping up.
After tax it is not close. A raise is not taxed at your average rate. It is taxed at your marginal rate — the rate on your last dollar. Stack federal tax, Social Security, Medicare and state tax at each state’s median wage and that marginal rate runs 1.2 to 1.5 times the average rate. So take-home grows more slowly than the raise does.
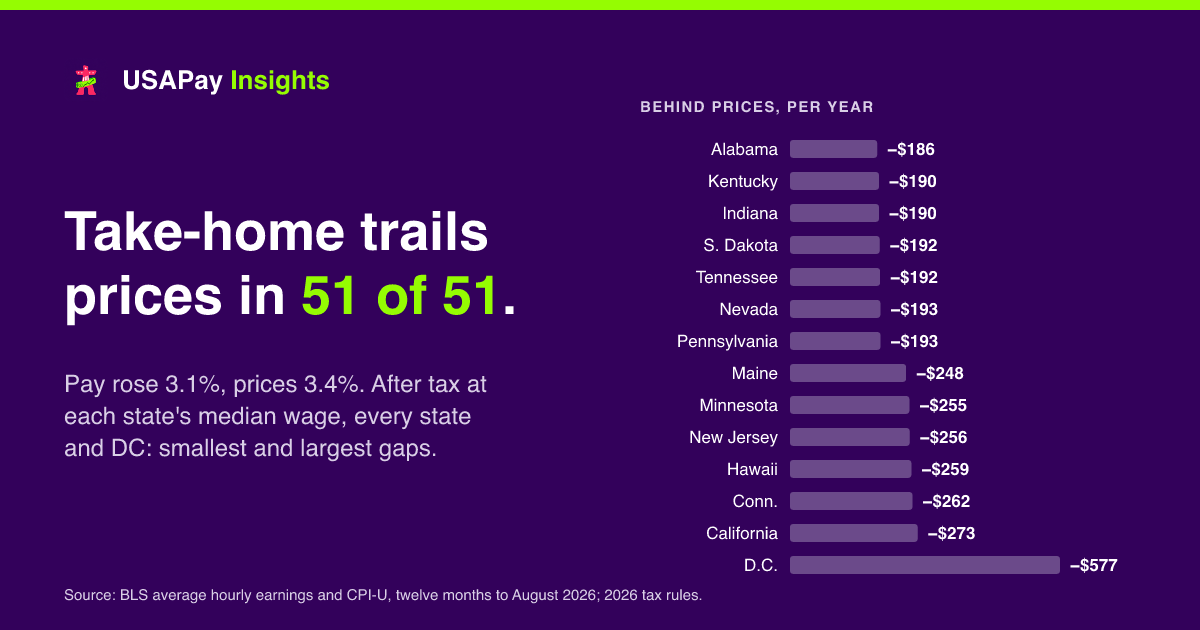
We put the national 3.09% rise through every state’s taxes, at that state’s own median full-time wage. In 51 of 51 jurisdictions the after-tax raise came in below 3.40%. The median worker keeps between 62% and 80% of the raise; the rest goes in tax before it reaches the bank.
A worked example: Texas
Texas has no income tax, so this is the gentlest case. The median full-time wage there is $48,620. A 3.09% raise adds $1,500 to gross pay. Federal income tax and FICA take $295 of it — a marginal rate of 19.7%, against an average of 15.2% on the salary itself — leaving $1,205, or 80%. Take-home rises 2.92%, against prices up 3.40%.
Every state, at its own median wage
Sorted from the smallest shortfall to the largest. “Against prices” is the year’s take-home after the raise, compared with this year’s take-home grown by 3.40%.
| State | Median wage | Raise | You keep | Take-home up | Against prices |
|---|---|---|---|---|---|
| Alabama | $45,670 | $1,409 | $1,070 (76%) | 2.89% | −$186/yr |
| Kentucky | $46,920 | $1,448 | $1,113 (77%) | 2.90% | −$190/yr |
| Indiana | $47,860 | $1,477 | $1,143 (77%) | 2.91% | −$190/yr |
| South Dakota | $47,080 | $1,453 | $1,167 (80%) | 2.92% | −$192/yr |
| Tennessee | $47,380 | $1,462 | $1,175 (80%) | 2.92% | −$192/yr |
| Nevada | $47,660 | $1,471 | $1,182 (80%) | 2.92% | −$193/yr |
| Pennsylvania | $49,690 | $1,533 | $1,184 (77%) | 2.92% | −$193/yr |
| Florida | $47,880 | $1,477 | $1,187 (80%) | 2.92% | −$194/yr |
| Mississippi | $40,120 | $1,238 | $945 (76%) | 2.82% | −$194/yr |
| Arkansas | $43,630 | $1,346 | $1,032 (77%) | 2.86% | −$195/yr |
| Texas | $48,620 | $1,500 | $1,205 (80%) | 2.92% | −$195/yr |
| Louisiana | $45,520 | $1,405 | $1,086 (77%) | 2.88% | −$197/yr |
| Michigan | $49,270 | $1,520 | $1,157 (76%) | 2.90% | −$199/yr |
| Wyoming | $50,270 | $1,551 | $1,246 (80%) | 2.93% | −$200/yr |
| Oklahoma | $45,600 | $1,407 | $1,067 (76%) | 2.86% | −$200/yr |
| Illinois | $51,960 | $1,603 | $1,209 (75%) | 2.91% | −$201/yr |
| West Virginia | $45,300 | $1,398 | $1,064 (76%) | 2.85% | −$204/yr |
| North Dakota | $52,480 | $1,619 | $1,301 (80%) | 2.93% | −$205/yr |
| North Carolina | $47,970 | $1,480 | $1,130 (76%) | 2.87% | −$205/yr |
| Arizona | $50,060 | $1,545 | $1,203 (78%) | 2.89% | −$209/yr |
| Iowa | $48,540 | $1,498 | $1,147 (77%) | 2.87% | −$212/yr |
| Georgia | $48,170 | $1,486 | $1,120 (75%) | 2.86% | −$212/yr |
| Kansas | $48,010 | $1,481 | $1,108 (75%) | 2.85% | −$213/yr |
| New Hampshire | $55,880 | $1,724 | $1,385 (80%) | 2.94% | −$214/yr |
| Montana | $48,740 | $1,504 | $1,138 (76%) | 2.86% | −$214/yr |
| Idaho | $47,970 | $1,480 | $1,111 (75%) | 2.85% | −$215/yr |
| Alaska | $61,000 | $1,882 | $1,512 (80%) | 2.97% | −$217/yr |
| Delaware | $52,190 | $1,610 | $1,198 (74%) | 2.87% | −$218/yr |
| Missouri | $47,800 | $1,475 | $1,116 (76%) | 2.84% | −$218/yr |
| New Mexico | $47,210 | $1,457 | $1,108 (76%) | 2.84% | −$218/yr |
| Nebraska | $48,980 | $1,511 | $1,146 (76%) | 2.85% | −$219/yr |
| Ohio | $49,380 | $1,524 | $1,182 (78%) | 2.86% | −$219/yr |
| Wisconsin | $50,270 | $1,551 | $1,170 (75%) | 2.85% | −$222/yr |
| Oregon | $57,000 | $1,759 | $1,266 (72%) | 2.89% | −$223/yr |
| Vermont | $56,390 | $1,740 | $1,338 (77%) | 2.91% | −$224/yr |
| Maryland | $59,510 | $1,836 | $1,388 (76%) | 2.92% | −$226/yr |
| Rhode Island | $56,780 | $1,752 | $1,323 (75%) | 2.90% | −$228/yr |
| Washington | $62,990 | $1,944 | $1,535 (79%) | 2.96% | −$229/yr |
| Massachusetts | $63,590 | $1,962 | $1,470 (75%) | 2.94% | −$230/yr |
| Virginia | $55,690 | $1,718 | $1,282 (75%) | 2.88% | −$231/yr |
| Utah | $50,110 | $1,546 | $1,154 (75%) | 2.83% | −$231/yr |
| New York | $59,670 | $1,841 | $1,372 (75%) | 2.91% | −$231/yr |
| Colorado | $59,800 | $1,845 | $1,393 (76%) | 2.90% | −$238/yr |
| South Carolina | $46,490 | $1,435 | $1,078 (75%) | 2.77% | −$242/yr |
| Maine | $51,430 | $1,587 | $1,160 (73%) | 2.80% | −$248/yr |
| Minnesota | $56,920 | $1,756 | $1,284 (73%) | 2.83% | −$255/yr |
| New Jersey | $58,570 | $1,807 | $1,345 (74%) | 2.85% | −$256/yr |
| Hawaii | $56,320 | $1,738 | $1,268 (73%) | 2.82% | −$259/yr |
| Connecticut | $59,690 | $1,842 | $1,344 (73%) | 2.84% | −$262/yr |
| California | $58,240 | $1,797 | $1,313 (73%) | 2.81% | −$273/yr |
| District of Columbia | $91,540 | $2,825 | $1,747 (62%) | 2.55% | −$577/yr |
Why the spread runs the way it does
Alabama comes out best, $186 a year short; District of Columbia worst, $577 short. Two things drive it. A higher median wage sits in a higher bracket, so more of each extra dollar is taxed — District of Columbia’s median of $91,540 is the highest in the table, and it keeps only 62% of its raise. And a graduated state income tax takes a bigger bite of the last dollar than a flat one or none at all: of the 10 states at the top of the table, 4 levy no tax on wages and 3 more tax them at a single flat rate.
What BLS itself says
The Bureau of Labor Statistics’ own Real Earnings release for the same twelve months, which deflates by seasonally adjusted prices, puts the change in real average hourly earnings at -0.3%. It also reports the fact that cuts the other way: the average workweek grew 0.6%, which lifted real weekly earnings to +0.3%. Across the whole workforce, people kept pace by working longer. The worker in the table above works the same hours both years, which is why hourly pay is the comparison that fits them.
Last month, and this one
This is the second month running. In the twelve months to July, pay rose 3.24% and prices 3.36%; in August the gap before tax widened to 0.31 points. The direction did not change; the table above was recomputed on the August figures.
Sources: BLS series CES0500000003 (average hourly earnings, all employees, total private, seasonally adjusted) and CUUR0000SA0 (CPI-U, all items, not seasonally adjusted), retrieved 2026-09-11; state median wages from U.S. Bureau of Labor Statistics, Occupational Employment and Wage Statistics (OEWS), May 2025 state estimates, May 2025. Single filer, no pre-tax deductions, federal, FICA, state income tax and state payroll contributions from this site’s 2026 engine. Local income taxes are not included.
Calculate your own take-home pay
Any salary or hourly wage, all 50 states and DC, with city taxes and payroll deductions.
Use the free calculatorFrequently Asked Questions
Why does a raise grow take-home pay less than the raise itself?
Which state's workers came closest to keeping up with prices in August?
How much of a 3.09% raise does a Texas worker keep?
Useful calculators for this guide
Disclaimer: Figures are estimates of annual tax liability from published federal and state rules, not paycheck withholding, and not tax advice. Your own situation may differ.